Bloomberg’s Harvey Stein on the “Dirty Secret” of Big Data
April 23, 2018


Most risk calculations are based on historical data, so in any attempt to improve those calculations, “The quality of the data becomes very important,” says Harvey Stein, the head of the Quantitative Risk Analytics Group at Bloomberg. So it only makes sense that when Stein started looking at ways to improve Bloomberg’s enterprise risk product, he went straight to the data.
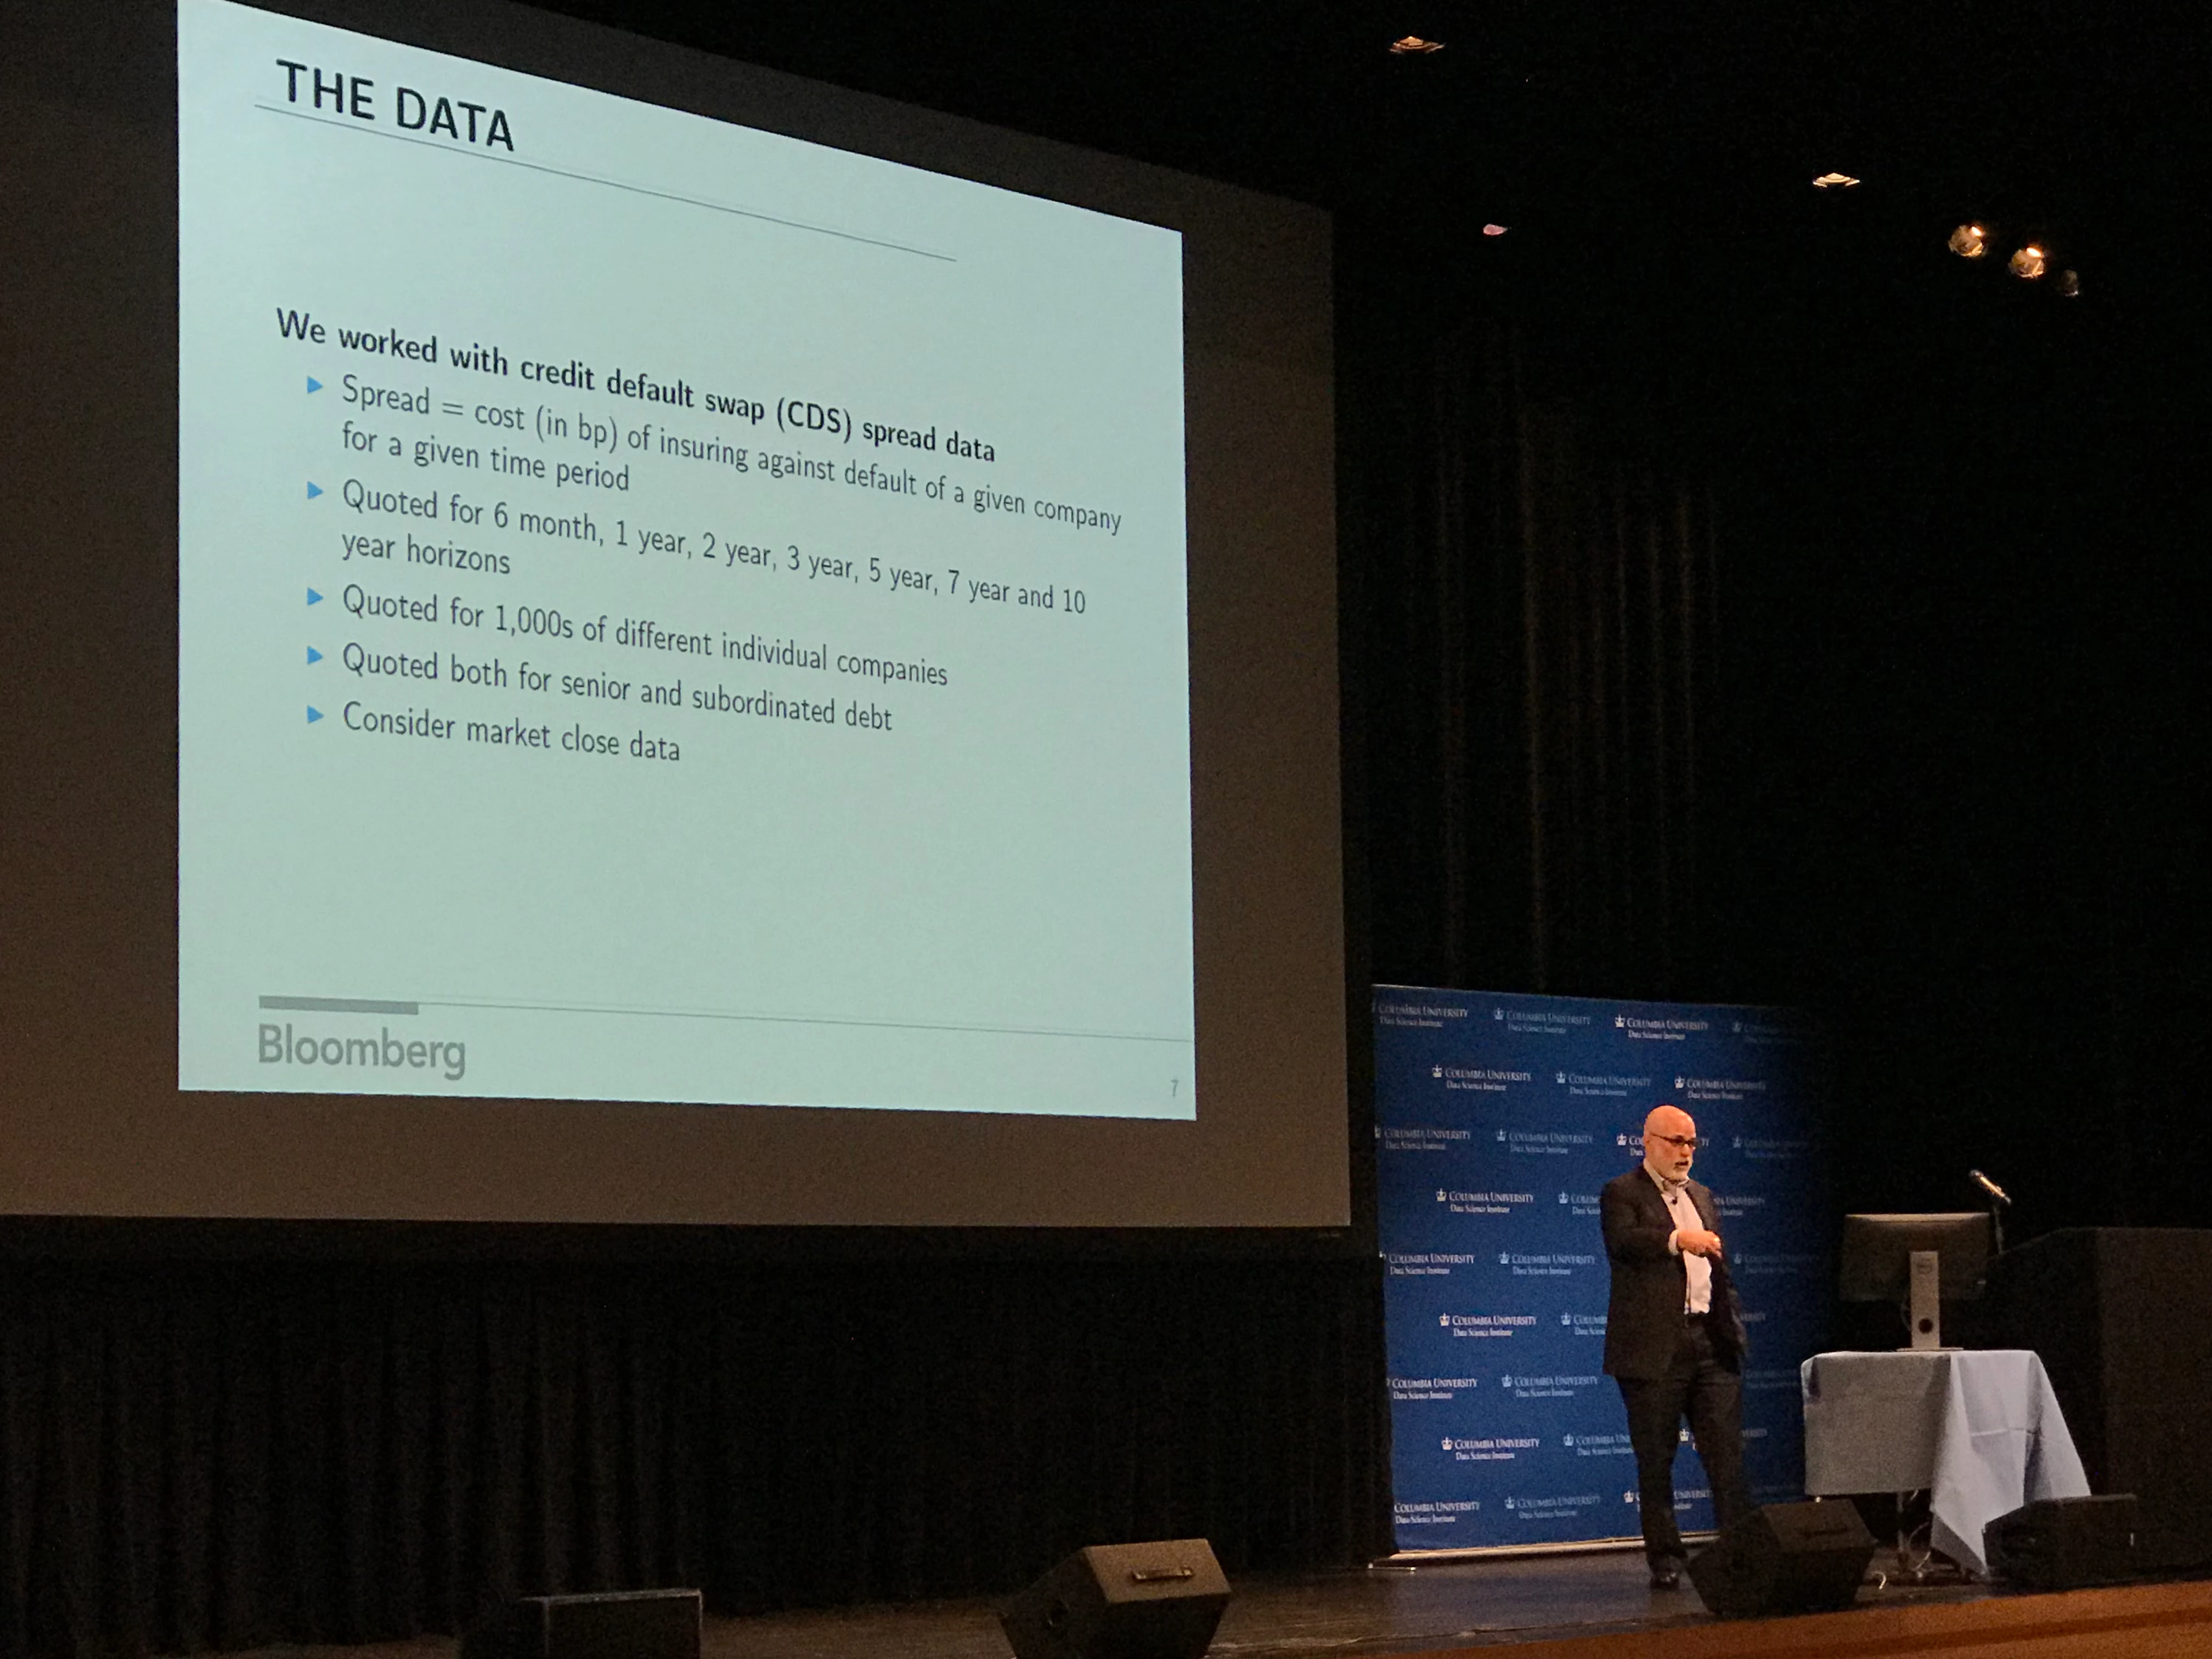
There are all sorts of things that can go wrong with datasets, says Stein, and all sorts of ways those imperfections can impact subsequent calculations. In a presentation entitled “Big Data’s Dirty Secret,” Stein presents a novel method to account for missing or anomalous values in time series data, with the goal of also improving the usefulness of the algorithms built on top of them. He delivered the closing presentation at the 2018 Machine Learning in Finance Workshop co-hosted by the Data Science Institute (DSI) at Columbia University and Bloomberg, which took place in Columbia University’s Lerner Hall on Friday, April 20, 2018.
In finance, says Stein, bad data has very different effects depending on how it’s being used. Someone working in the front office might notice the bad data, and will likely ignore it. But the bad data often gets recorded, and its ramifications start to ripple throughout the financial world. The problem isn’t limited to risk calculations, says Stein, calling the issue “practically universal.”
Bad data affects different parts of the market in different ways. If you’re trying to calculate a relative valuation and the curve is off, “there’s not a tremendously bad impact on the results,” says Stein. If the curve looks odd, you can fix it. If there’s a missing point, it can be interpolated.
In marking to market, there’s more of a problem, because your books might be off. A trading strategy incorporating bad values could either prevent a trader from finding a useful strategy or needlessly complicate it. In risk analysis, deleting outliers can artificially reduce risk measures, while leaving them in could inflate those same measures. “Suddenly you’re taking in extreme moves of the market that aren’t realistic,” says Stein.
In Stein’s case, there isn’t a practical way to manually investigate each data point, because there are thousands of time series forming the basis of calculations that are made nightly. “You need to try to develop robust algorithms for inspecting and correcting the data,” says Stein.


In his presentation, Stein discussed the use of spread data relating to credit default swaps. Even a cursory look at this data indicates trouble. For example, there is no data for six-month credit-default swaps from 2007 to mid-2009 – they just weren’t traded. Recent Basel regulations, says Stein, require financial institutions to determine their risk factors going back to 2007. So Stein can’t just ignore the missing data. He has to estimate where the six-month price would have been or use something else as a proxy.
There are a number of ways to fill in missing values, but none do a particularly good job of preserving the variances and covariances in and between time series. A statistical regression is one approach. Interpolation essentially amounts to connecting the dots. Flat-filling is simply duplicating the previous value. Cluster analysis is a little more geometric, translating sets of points into vectors and looking at the distance between them. Or, in an effort to separate noise from the signal, one could use a neural network to compress the data and then reconstruct it.
Stein instead used a technique called Multi-channel Singular Spectrum Analysis (MSSA). The correlation of each day’s value with previous days’ values, says Stein, produces a correlation matrix expressing the autocorrelation of the series. The key is to figure out the most important pieces of this new matrix. “You might find there are certain moves that happen over time, or from one day to another, that are much more common,” he says.
MSSA is able to do this with multiple time series, and help Stein come up with values that are much less likely to inappropriately sway the data set one way or another. “You want to fill the holes in such a way that it respects the correlations between all the different time series and the correlations of their shifts with each other,” says Stein. The short-term result is a better time series; the longer-term result should be more accurate risk calculations.
When asked to reflect on the work he’s done, and this research, Stein admits there is still a way to go. Then he says with a chuckle, “But this is Bloomberg, so of course we’re always making everything better.”