Bloomberg engineers partner with City of Chicago on Equity Dashboard
June 29, 2021
Data is widely perceived by city governments as a tool not just for innovation, but also as a means to drive social change. When Lori Lightfoot was elected the Mayor of Chicago in 2019, she had campaigned on a platform that included transparency as one of its pillars. Shortly after taking office, Mayor Lightfoot developed the Office of Equity and Racial Justice (OERJ), which seeks to achieve equity in the city’s service delivery, decision-making, and resource distribution.
Linda Gibbs and her colleagues at Bloomberg Associates, the non-profit consulting arm of Bloomberg Philanthropies, which advises mayors around the globe on how to build better cities, were already working with the City of Chicago on the implementation of emerging technologies to make better use of city data. They recognized this new development as an opportunity to bring in a volunteer team of Bloomberg engineers to help build and deploy data-driven technologies to give the city’s residents access to data that verifies that the composition of its workforce reflects the public they serve.
The transparent city
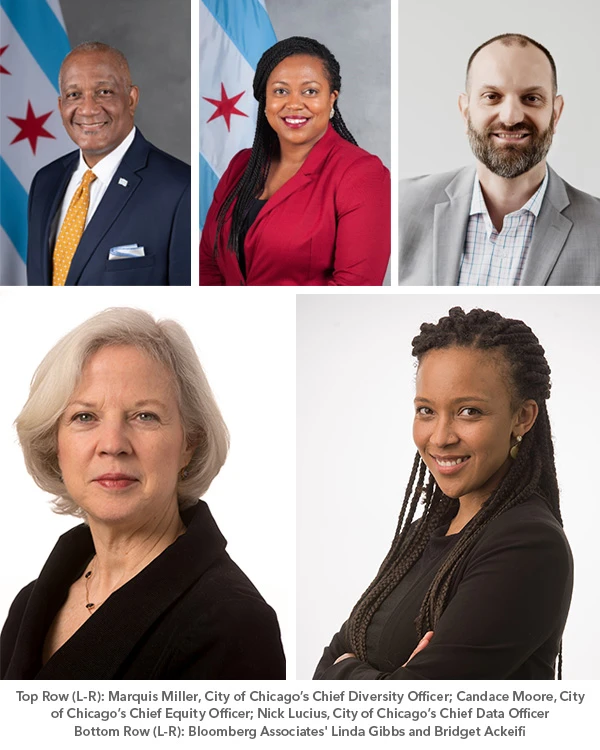
The groundwork for a data-driven Chicago had been laid years prior. In 2018, Marquis Miller, now Chicago’s Chief Diversity Officer, was working in the city’s Department of Human Resources. He began exploring how the department could approach diversity initiatives. A colleague introduced him to data scientist Nick Lucius and they brainstormed about how making data more accessible could help them achieve the city’s diversity and inclusion goals. Lucius went on to become Chicago’s Chief Data Officer. When Mayor Lightfoot took office, Miller’s vision for the city’s workforce diversity data began to take shape:
It became clear that we had to think differently about traditional diversity and inclusion, and begin to sew equity into our conversation. And that’s where it became even clearer to me that a dashboard would take us to that place. No more will we be trading on what we think is happening. We would be able to pull data and look at it and actually disaggregate it, so we can make more strategic decisions about where we should go and how we should go about it.
Miller and Lucius wanted to make it easier for departments to prepare for their annual budget hearings. The data being made public would make leaders fully accountable to that public. The second mandate was to standardize the terminology being used to talk about diversity. Putting all of the data in one place would help the different departments speak about diversity in the same way and interpret the numbers consistently. Everyone needed to be “rowing in the same direction,” as Miller puts it.


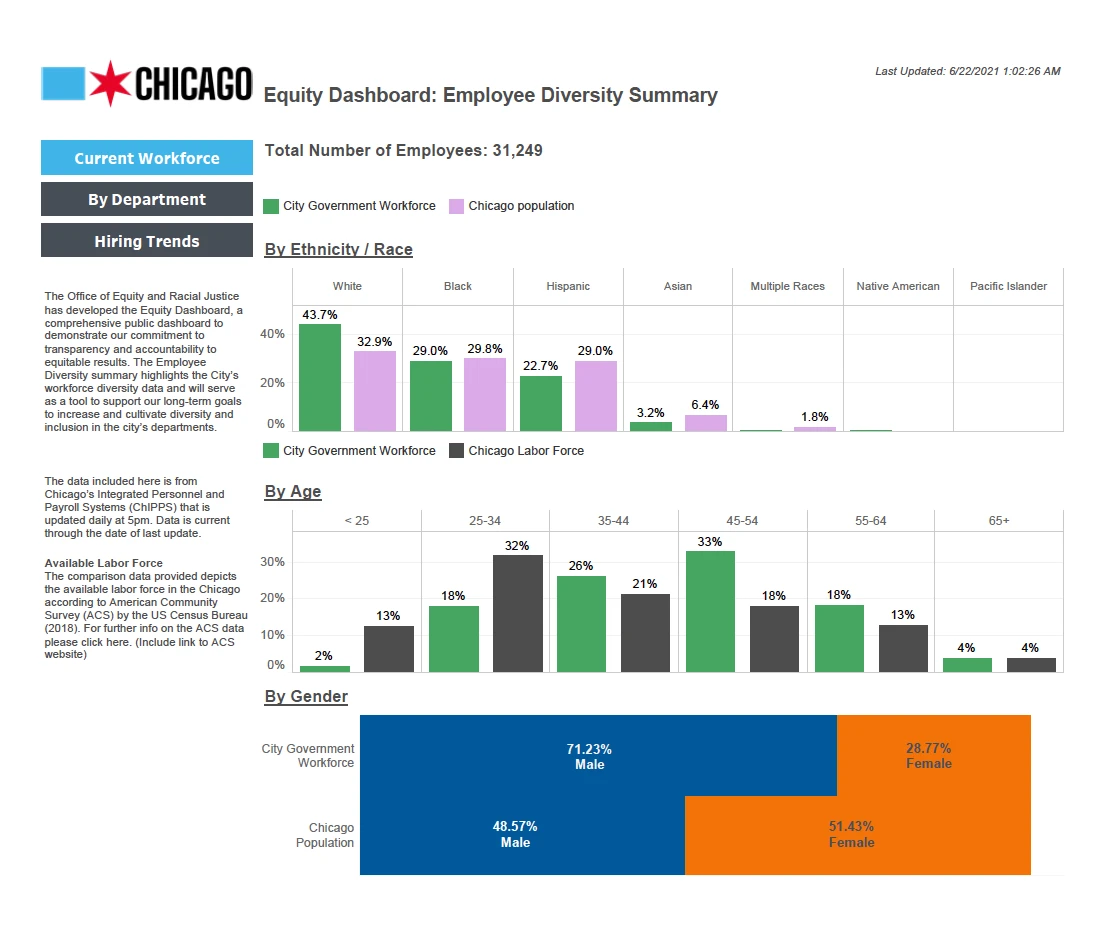
Bloomberg Associates partnered with the administration on what would become the Equity Dashboard. This data visualization platform would be built under the oversight of the City of Chicago’s Chief Equity Officer, Candace Moore. This intuitive user interface (UI) would be designed to provide non-data scientists with data on how hiring compares to the demographic composition of the city; to break down various representation categories such as race, gender, and age; and to explain from which neighborhoods city government employees were hired. The dashboard would be updated daily, providing real-time data that would chart changes in hiring trends over time.
“We’ve seen an increase in requests for dashboards from mayors because they want to share data with the public as a rationale for budgeting or to influence policy,” says Bloomberg Philanthropies’ Malia Simonds. Chicago’s Equity Dashboard is the first of a series of dashboards that are in development.
“The city government in Chicago is one of the biggest employers, the biggest procurers, and one of the most significant institutions in the entire city,” says Bloomberg Associates project manager Bridget Ackeifi. “As such, it’s important to understand how policy is driven, how money is spent, and how the demographic makeup of the city’s government might impact how those decisions are made.”
Miller elucidates how something as abstract as a data science project can bring awareness to areas where people are in need.
After the events of the summer… some of [our employees’] neighborhoods were so hard hit that it forced us to think — could we or should we be thinking differently about our policies and practices in such a way that they land as we need them to, because of how they impact our employees? In fact, we had a couple of employees — even in the mayor’s office — who had difficulty getting basic goods and services in the neighborhood because of all the unrest. When you stop and think about where those employees are, it gives you a different frame for how solutions need to be put in place.
There are three target groups of theoretical users for the Chicago Equity Dashboard. The first is the city government itself. The second use case consists of external institutions like academic researchers, think tanks, nonprofits and journalists. Lastly, since data is a public good, the dashboard is open to the general public.


Leveraging engineers’ skills to give back
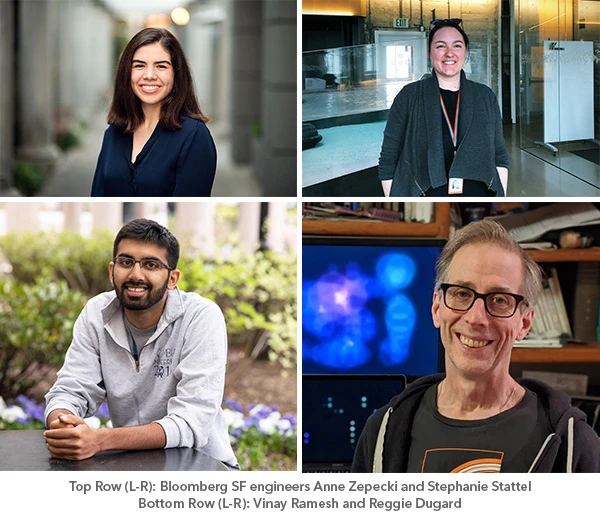
However, city governments don’t always have the engineering resources on-hand to build software. Since the development of the dashboard was in the service of the public good, Bloomberg’s Corporate Philanthropy team joined the effort to recruit a team of volunteers — a group of software engineers from Bloomberg Engineering’s office in San Francisco: Reggie Dugard, Stephanie Stattel, Vinay Ramesh, and Anne Zepecki.
“A key strategy of Bloomberg’s Corporate Philanthropy team is to engage talented employees in meaningful volunteer opportunities, where they can share their time and skills,” says Simonds. Corporate Philanthropy coordinates philanthropic volunteer projects, from planting trees to painting streets, to skills-based projects like building dashboards for city governments and teaching high school students to build robots or learn to code in Python.
Bloomberg has a strong volunteering culture, with myriad options from which volunteers can choose — everything from building homes with Habitat for Humanity to planting community gardens to serving at food banks. These volunteer opportunities are a chance for individuals to give back, and for teams to build camaraderie. This particular group of volunteers was composed of members and allies from the San Francisco chapter of the Bloomberg Women in Technology (BWIT) community, which has previously worked on projects for different departments in the City of San Francisco.
Skills-based volunteering is an important focus area for the Bloomberg Corporate Philanthropy employee engagement program. When engineers, for example, are able to build a bleeding-edge dashboard to promote civic accountability, it gives them a sense of satisfaction that they are able to use their unique capabilities to do good in the cities in which they work and live.
“Rather than the many other projects that are a single day or a handful of hours, like volunteering to clean up the shoreline or going to the food bank, this was something that was more specialized and ongoing,” says Dugard. “That was what attracted me to it, and I think it really turned out great.”
“Growing up, I was involved in my town’s government,” says Zepecki. “So being able to step into a role where I could leverage my particular strengths and expertise as an engineer to help out at a city level was such a unique opportunity.”
In addition to its attractiveness as an opportunity to serve the community of Chicago, the engineers were also interested in this project due to its defined scope and aggressive timeline. It wasn’t going to be a “one-and-done” project, but it also wouldn’t drag on indefinitely — its scope was ambitious, but it came with clear parameters. Unlike many volunteer opportunities, it was a chance to start a project with a dynamic group of people and to bring it across the finish line together.
“What’s great about these kinds of public-private partnership is that they have a beginning and an end, a clear deliverable, and the city is part of the process, so they can step in to sustain the work once our engineers have completed their scope,” says Simonds.
Getting down to business
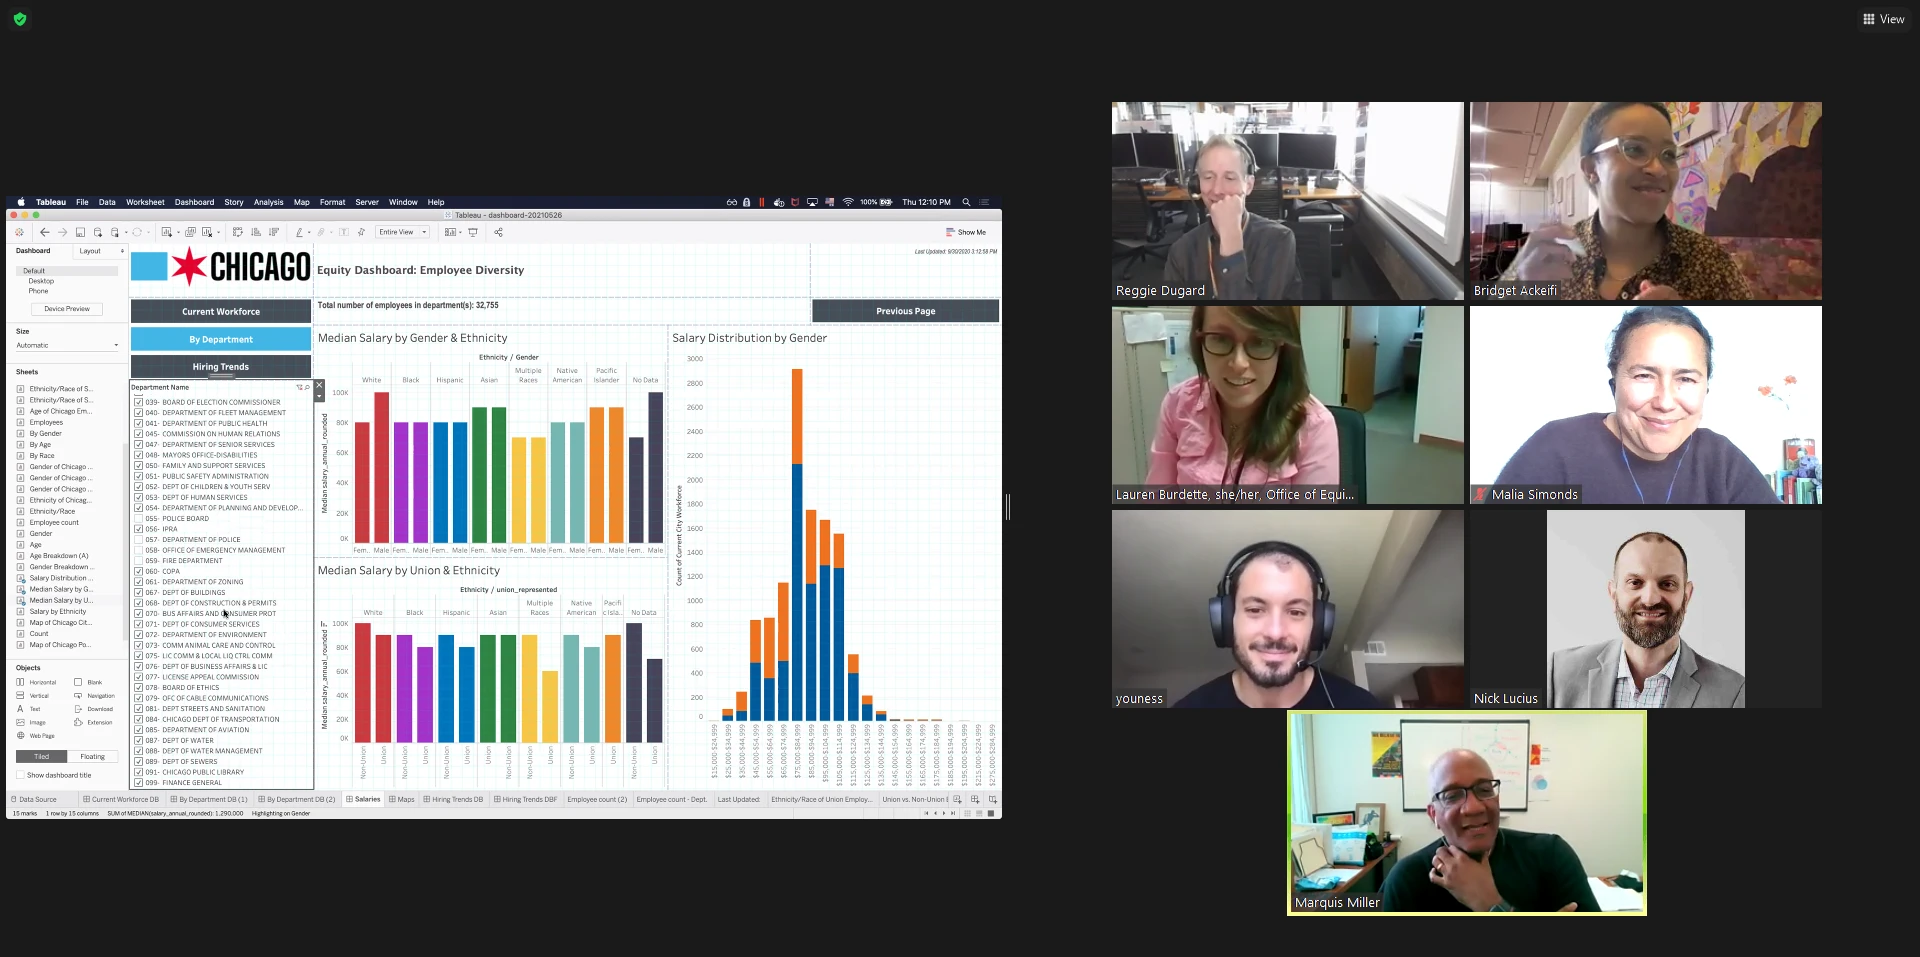
The first big decision was choosing the right dashboard in the first place. Lucius and Bloomberg’s engineers landed on data visualization software from Tableau, mainly due to its built-in palette of colors that translate well to colorblind people, a necessity for the sake of website accessibility.
“There was a lot of work the whole group did to research what options there were and evaluate them from our experience,” says Ramesh. They not only needed to use a platform that would be able to display the data in the most intuitive way. It also needed to be easy for the City of Chicago to host and maintain after the Bloomberg engineers had finished the project and ceased their involvement.
The next issue was choosing the right sources of data.
“What do these codes mean?” asked Zepecki at the time. “How can we translate this so that it’s meaningful if you’re a member of the public?” They worked alongside the administration in an effort to cleanse the existing data and to reconcile different sources of data that recorded the data in disparate ways.
“The trick was to try to find the right subset of census data that would correspond to the City of Chicago’s workforce, because there are different geographic areas in different data sets” says Dugard. “I met with epidemiologists in the City of Chicago to see what they used for their data, and that was a challenge, but we finally came up with something that worked.”


Fortunately, the City of Chicago had already committed to making all the relevant data publicly available, so all the data the team worked with had already been sanitized for public consumption.
“A large part of Bloomberg’s business is data,” says Zepecki. “Visualizing data in Jupyter notebooks is something all of us have thought about before.”
For her, the goal was to not only present the data in a form that was more comprehensible than a bunch of spreadsheets, but also to give users the tools to “slice and dice” the data for their own purposes. Equity Dashboard users can set their own filters and compare different side-by-side breakdowns of demographics.
Ramesh says the team approached the project like they would any other that comes across their desks at work. First, they performed initial research to choose the right technology stack. They communicated heavily with the City of Chicago, poring over mockups. Once they had pieces of the work ready for review, they got feedback, then iterated and refined the product further over time.
This tactical approach helped keep the Bloomberg team on target so that the dashboard would be ready in time for the city’s fall budgeting season.
“Without that structure,” Stattel says, “I don’t know if we would have landed in a place where everyone was on the same page.”
Passing the baton
A project like this highlights the value that public-private partnerships can create, allowing governments to access a wider range of technological innovation and expertise, which corporate partners have the skills to leverage. “Infrastructure” has been established as a watchword for 2021 in the U.S. and around the globe, with the meaning of the term expanding to include a range of services and systems that go beyond traditional definitions. With software having “eaten the world,” these projects are likely to involve complex technological integrations. We can expect that successes with small, contained public good projects like this one will point to a future of deeper integrations between the public and corporate sectors.
Now that the Equity Dashboard has been made available to the public, Dugard is helping out Gibbs and her team with Phase 2 of the project. This has enabled him to observe firsthand how she and the City of Chicago are continuing to build on what his volunteer team accomplished.


At the City of Chicago, Miller is looking ahead to the future of the project as well.
To achieve not just Mayor Lightfoot’s goals — goals that are relevant to the overall city’s growth and development — we’ve got to think about new tools and new practices that are going to allow us to truly be an employer of choice… We’ve got to try to take it to another level, because… this is something new for municipal government.
“The project itself was so rewarding,” says Ramesh, “because of how intentional the City of Chicago was about doing good work, asking insightful questions of our engineering team to ensure that the data would be able to tell the story around equity in city government.”
“It was really nice to do something outside of my day-to-day work and stretch into that,” says Stattel. “Getting to see this project released was really exciting, as was getting to work with people outside of the team that I don’t normally get to work with.” But for her, this was much more than a fun volunteer project. “The events of the summer really brought home that this was more than a technical project,” she says. “There were people and lives behind this data.”
Simonds is confident that the project can be replicated in other cities. “We’ve developed a scoping document so we have a better sense of what kind of talent we are looking to recruit for these projects,” she says. Two groups of Bloomberg engineers are already working on dashboard projects for the cities of Detroit, MI, and Newark, NJ.
Cities across the U.S. are taking a hard look at the historical treatment of minorities. For the City of Chicago, this project is just one small piece of an overall effort to address systemic bias and maltreatment of the city’s historically marginalized communities. Putting all the numbers out there is an act of bravery, Gibbs says.
“It is threatening. It is intimidating. It is revealing. You’re putting your dirty linen out there, but it embraces the belief that if others participate in the conversation with you, change happens faster.”